
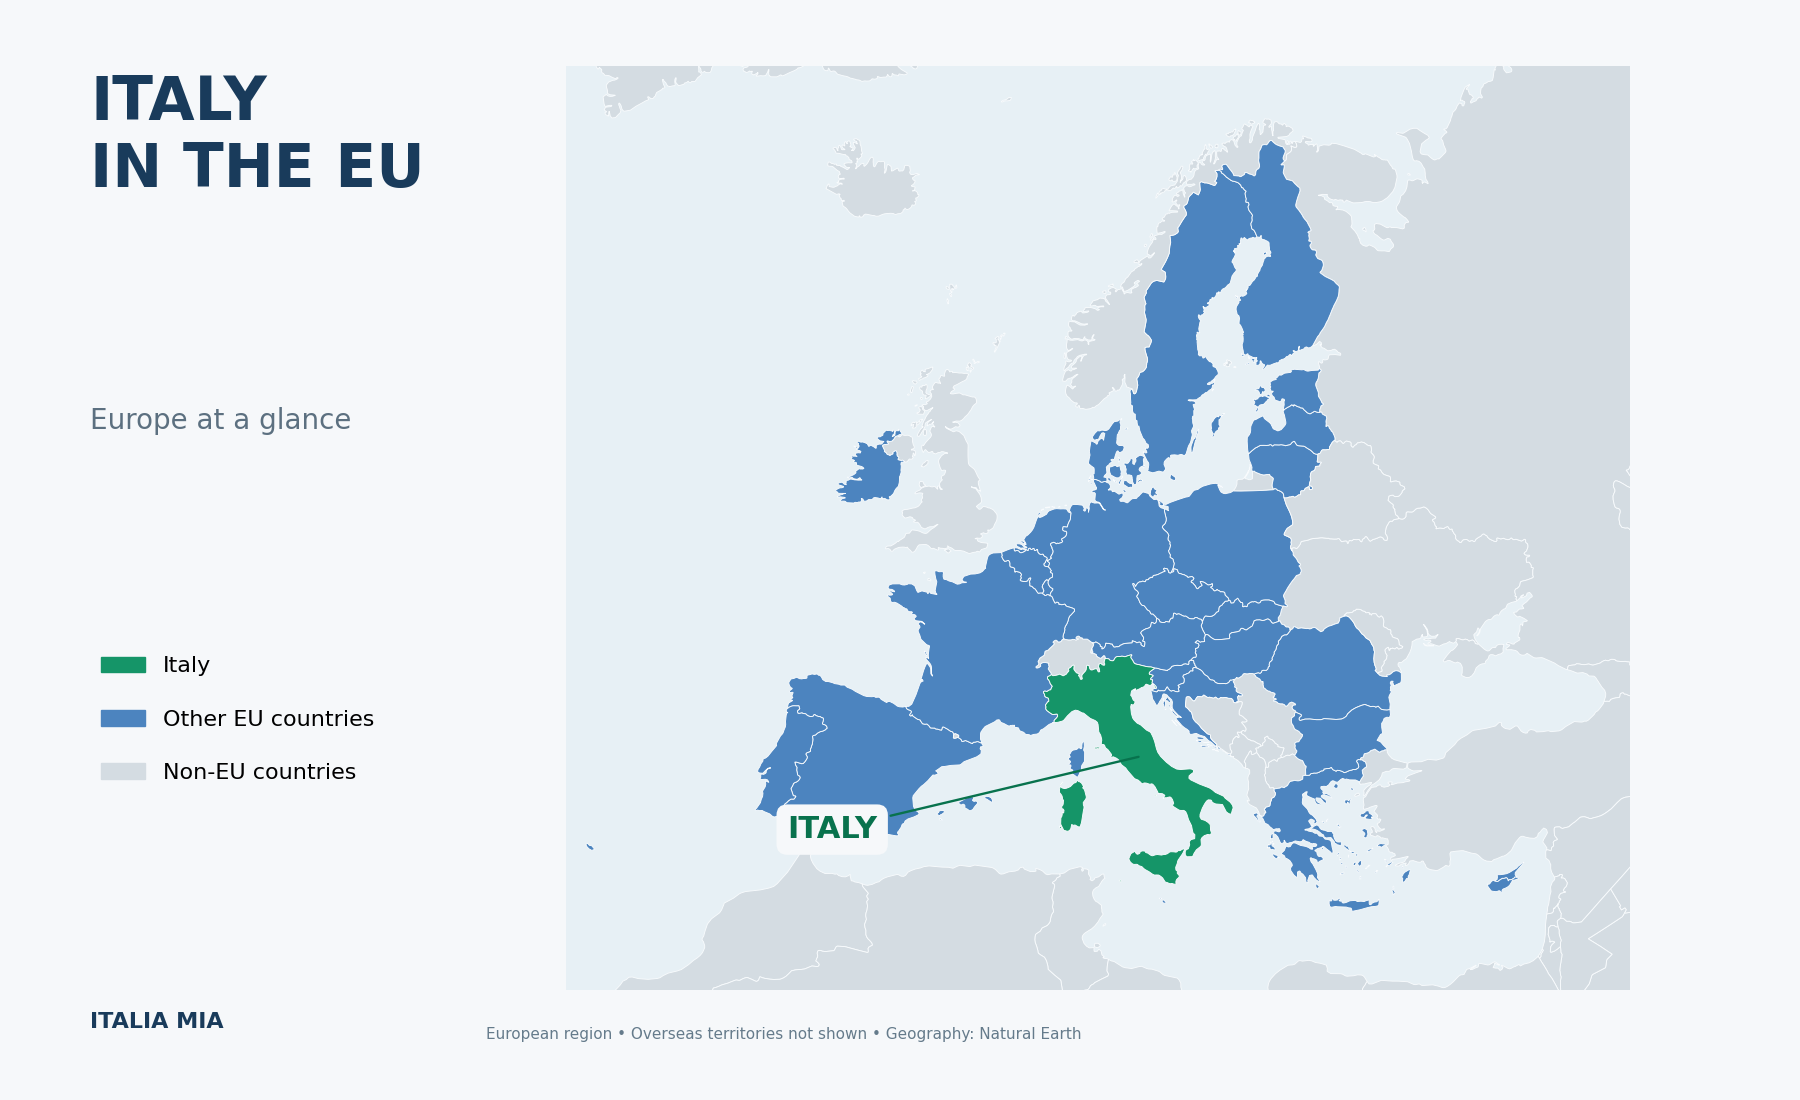
 Italy’s position in the European Union combines economic influence, strong tourism demand and long life expectancy with persistent challenges in employment, education and household income.
For anyone considering living in Italy, these comparisons offer useful context. However, national averages cannot tell you whether a particular city will suit your budget, career or family. Everyday conditions depend on where you live, how you earn your income and which services you need.
This guide uses dated European statistics to explain how Italy compares with other EU countries. Reference years differ because employment, education, income and demographic figures are published on different schedules.
Italy’s Economy: Size and Living Standards Are Different Measures
Italy remains one of Europe’s major economies. Its economic importance, however, should not be confused with the average prosperity of its residents.
A useful comparison is GDP per person expressed in purchasing power standards. This adjusts for differences in national price levels, making comparisons more meaningful than simply converting economic output into euros.
Eurostat’s preliminary estimates for 2025 placed Italy within 10% below the EU average on this measure. France, Cyprus, Czechia, Spain and Slovenia were also in that range. Italy therefore sits relatively close to the European average, although below several wealthier northern and western member states.
GDP per person measures economic production. It does not represent the salary, disposable income or savings of a typical household.
For someone planning a move, a local budget is more useful than a national GDP figure. Our guide to the cost of living in Italy explains how housing, transport and everyday spending affect the amount you need.
Employment: Italy’s Most Significant Gap
Employment remains one of the clearest differences between Italy and its EU neighbours.
In 2025, Italy’s employment rate for people aged 20–64 was 67.6%, compared with 76.1% across the EU. This was the lowest national rate in the Union, with a gap of 8.5 percentage points below the EU average.
By comparison, the Netherlands recorded 83.4%, Czechia 82.9% and Greece 71.0%. Among women aged 20–64, Italy’s employment rate was 58.0%, against an EU average of 71.3%.
These figures measure the proportion of the relevant population that is employed. They are different from unemployment rates, which count unemployed people as a share of the labour force.
A country can have relatively modest unemployment while still having low employment if many people are outside the labour force.
For prospective residents, the practical implication is to investigate the local job market before choosing a destination. Employment prospects depend on your occupation, qualifications, Italian-language skills and location. The guide to moving to Italy provides a starting point for those decisions.
Salaries: Compare Annual Pay Before Estimating Take-Home Income
Italy’s average earnings are below the EU average, but salary comparisons require consistent definitions.
For 2024, Eurostat’s average annual full-time adjusted salary was approximately €33,500 in Italy, compared with €39,800 across the EU. On this measure, Italy was around 16% below the EU average and close to Spain, where the figure was approximately €33,700.
This is an average adjusted to express part-time salaries as full-time equivalents. It is neither a median salary nor a take-home-pay estimate.
When assessing a job offer, compare the gross annual salary, contracted hours, contract duration and benefits. Dividing annual pay by twelve may also fail to reflect how an employer distributes payments during the year.
Purchasing power matters just as much. A higher salary accompanied by expensive housing and a long commute may leave less spending money than a lower salary elsewhere.
For this reason, “Italy is cheaper” is too broad to be useful. Compare the actual income and costs associated with the town where you intend to live.
Education: Progress, but a Persistent Qualification Gap
Italy’s education system should not be reduced to a single ranking. Participation, qualifications, learning outcomes and access to employment measure different things.
One important indicator is the share of young adults who have completed tertiary education, including university degrees and other recognised higher qualifications.
In 2024, 31.6% of Italians aged 25–34 held a tertiary qualification, compared with 44.1% across the EU. Italy’s share had improved from 25.2% in 2015, but remained substantially below the European average.
The newer EU-wide figure reached 44.8% in 2025, approaching the European target of at least 45% by 2030. That figure should not be compared directly with Italy’s 2024 result as though both described the same year.
Qualification rates do not establish the quality of an individual university or school. Families should examine language support, transport and the specific school available locally. University applicants should consider the programme, teaching language, admission requirements, accommodation costs and links with employers.
Tourism: A Major European Strength
Tourism remains an area where Italy performs strongly in European comparisons.
In the first half of 2026, Italy recorded 219.5 million nights spent in tourist accommodation establishments. Spain recorded 222.8 million and France 193.0 million.
Italy’s total increased by 6.7 million nights compared with the first half of 2025—the largest absolute increase among EU countries over that period.
These are accommodation nights, including domestic and international guests. They are not counts of unique tourists: one person staying five nights contributes five nights to the total.
Strong tourism demand can support businesses and employment. For residents, it also makes seasonality, visitor traffic and accommodation availability important considerations when choosing a neighbourhood.
If you are researching destinations, browse our Italy travel guides alongside the practical information in Living in Italy. A place that works beautifully for a holiday may require a different assessment for year-round life.
Quality of Life: Strong Longevity, with Local Differences
Life expectancy is one of Italy’s strongest comparative indicators.
Eurostat’s Demography of Europe 2026 publication reports life expectancy at birth of 83.7 years in Italy for 2024, compared with 81.5 years across the EU. Spain recorded 84.0 years and Sweden 83.8 years.
These figures supersede the earlier provisional estimates that placed Italy at 84.1 years.
Life expectancy describes population mortality patterns. It does not predict an individual lifespan or establish that healthcare access is equally good everywhere.
For someone moving to Italy, practical questions include the availability of a local doctor, nearby hospitals, specialist appointments and transport to treatment. Our overview of the Italian healthcare system discusses services, costs and waiting lists.
Quality of life also depends on housing, financial security, social connections and the demands of daily travel. A national longevity advantage cannot replace an assessment of those local conditions.
An Ageing Population
Italy also has the EU’s highest median age.
On January 1, 2025, Italy’s median age was 49.1 years, compared with 44.9 years across the EU. Ireland had the lowest figure, at 39.6 years.
Median age means half the population is younger and half is older. It should not be described as the average age.
This demographic profile makes the availability of care, accessible housing and dependable local services especially relevant when assessing a place to live.
What These Comparisons Mean for Living in Italy
The figures reveal different strengths and weaknesses. Italy performs well on longevity and tourism, while employment participation and young adults’ higher-education attainment remain below EU averages. Average salaries also trail the European benchmark.
Your own experience will depend on a more specific set of questions.
If you need local employment, investigate jobs and realistic salaries first. If you bring a pension or another established income, concentrate on housing, healthcare and transport. Families should assess schools and childcare, while anyone considering a smaller town should test how daily life works throughout the year.
Before committing, spend time in the location outside its busiest holiday season. Visit ordinary neighbourhoods, check transport connections and build a budget around actual properties.
Italy’s appeal is easier to judge when the pleasures of living there are considered alongside the practical conditions that make everyday life work.
External Sources
Eurostat: GDP per capita in purchasing power standards—preliminary 2025 estimates
Eurostat: Employment rates in 2025
Eurostat: Annual full-time adjusted salaries in 2024
European Commission: Education and Training Monitor—Italy
Eurostat: Higher-education attainment in 2025
Eurostat: Tourist accommodation nights in 2026
Eurostat: Demography of Europe—2026 edition